Knowing how something changes over time can alter how we think about the topic. Are our efforts useful or not? Are there other factors making it change? Is it changing in the “right” direction? The US Department of Education data on chronic absenteeism was first collected during the 2013-14 school year and released in June 2016. That one year is the only national available data.
California has been collecting and publicly releasing chronic absenteeism data for the last four years. Using this data, I wanted to see how chronic absenteeism has changed.
California Attorney General Kamala Harris “did pioneering work with her sample data which shined a spotlight on the problem before she was elected to the U.S. Senate” said David Kopperud, Chairperson, California School Attendance Review Board. Harris and her agency collected data on elementary school chronic absenteeism believing that stopping the problem of truancy early would help address the problem of teen delinquency later, a criminal justice issue. “Since then, statewide data was collected for the first time in the 2016-17 school year in the CALPADS End of Year Collection,” said Kopperud. However, this is the first year of its collection and some data quality issues have come up that have delayed the final release of data until after March 2018. For example, 246 schools reported 100% attendance, including 83 San Francisco Unified School District schools.
California has not only local school districts, but County Boards of Education which supervise the many local school districts, charter schools, community colleges, etc. in each of the 58 counties. This data is only for elementary schools by county.
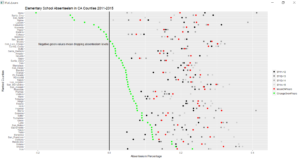
In the chart below, chronic absenteeism for four school years are graphed from 2011-12 (black dot) to 2014-15 (lightest gray dot). The average of the four years is the red dot. The difference of the 2014-15 chronic absenteeism rate and the 2011-12 rate is the green dot, which is then stack ranked from largest decrease (a negative number) to the largest increase (a positive number). The dark vertical line is zero on the horizontal axis, and the point where county chronic absenteeism rates change from negative, decreasing chronic absenteeism rates to positive, increasing chronic absenteeism county rates.

Trend data of chronic absenteeism rates from 2011 – 2015 for all California counties
A few interesting things to note. Despite the worries of Los Angeles about chronic absenteeism, the county is approximately at the state median in terms of chronic absenteeism; however San Francisco is in the bottom 10 percent of the state and as a city with great wealth, giving it possibly many resources, should be addressing this issue more seriously. A geographic oddity, Mono, the county at the top of the ranking with the greatest reduction in chronic absenteeism is a rural county bordering Nevada; and on its southern border is Inyo, at the bottom of the list, also a rural county bordering Nevada that has had the greatest increase in chronic absenteeism. About one in five counties have decreasing chronic absenteeism rates over the four years and further research should examine what those 12 counties are doing right.
This data comes from the “In School + On Track” Report.
Tags: chronic absenteeism, attendance, truancy, SFUSD, LAUSD, Mono, Inyo

Leave A Comment